Admin Guide
 SCORM Module (Classic) Debug Tool
The SCORM Debug tool is very useful for advanced users who are creating their own SCORM content and need to verify that it is interacting properly with the LMS.
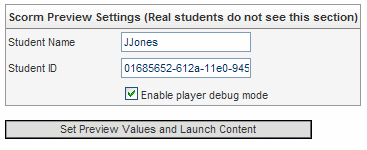
When you are previewing a course and you open a SCORM Module (Classic) you will be presented with the option to run the SCORM content through the SCORM debugger as shown below.

The options on this page are as follows:
| Option | Description |
| Student Name | Defaults to the logged in users name. You can change this value if you wish. |
| Student ID | Defaults to the logged in users ID. You can change this value if you wish. |
| Enable player debug mode | Check this option to enable the debug mode to debug your SCORM content. Leave this option un-checked to play the SCORM content normally without debug mode. |
| Set Preview Values and Launch Content Button | Click this button to play the Content (in debug mode if the option is checked). |
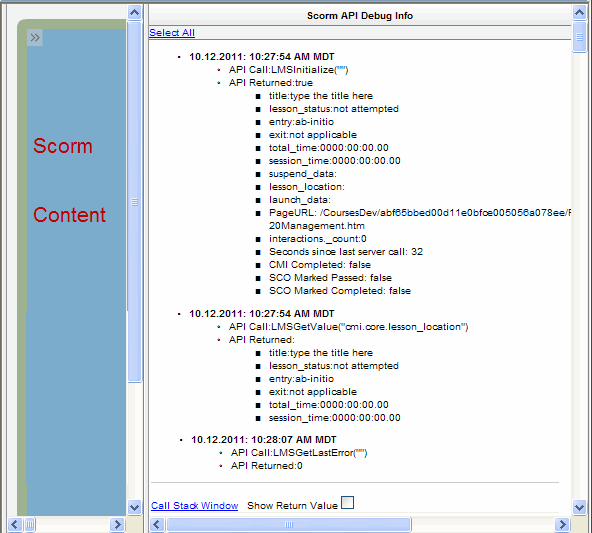
Below is an example of the SCORM debug tool. The content will be presented in the left frame and the debug information is presented in the right frame.

There are three options on this page:
| Option | Description |
| Select All Link | Selects all the debug information. Makes it easy to copy all the information so you can paste it into a document or e-mail for further analysis or discussion. |
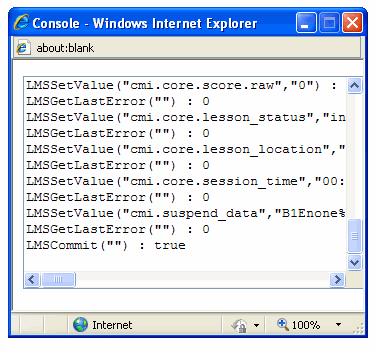
| Call Stack Window Link | Clicking this link will open a pop-up window with all the LMS API calls the SCORM content has made. See an example of the Call Stack Window below. |
| Show Return Value | Check this option to show all the return values for each of the calls to the API in the Call Stack Window. |
Below is an example of the Call Stack Window.
